Visualizing the History of Nobel Prize Winners: A DataCamp Project
Project Description
The Nobel Prize is awarded yearly to scientists and scholars in chemistry, literature, physics, medicine, economics, and peace, with the first prize awarded in 1901. Are there any biases in the way the honors are awarded? Use your data manipulation and visualization skills to explore the history of this coveted prize.
The Nobel Prize has been among the most prestigious international awards since 1901. Each year, awards are bestowed in chemistry, literature, physics, physiology or medicine, economics, and peace. In addition to the honor, prestige, and substantial prize money, the recipient also gets a gold medal with an image of Alfred Nobel (1833–1896), who established the prize.
The Nobel Foundation has made a dataset available of all prize winners from the outset of the awards from 1901 to 2023. The dataset used in this project is from the Nobel Prize API and is available in the nobel.csv file in the data folder.
In this project, you’ll get a chance to explore and answer several questions related to this prizewinning data. And we encourage you then to explore further questions that you’re interested in!
Tasks
Analyze Nobel Prize winner data and identify patterns by answering the following questions:
What is the most commonly awarded gender and birth country? Storing the string answers as top_gender and top_country.
What decade had the highest proportion of US-born winners? Store this as an integer called max_decade_usa.
What decade and category pair had the highest proportion of female laureates? Store this as a dictionary called max_female_dict where the decade is the key and the category is the value.
Who was the first woman to receive a Nobel Prize, and in what category? Save your string answers as first_woman_name and first_woman_category.
Which individuals or organizations have won multiple Nobel Prizes throughout the years? Store the full names in a list named repeat_list.
Loading in required libraries
import pandas as pd
import seaborn as sns
import numpy as np
import warnings
warnings.filterwarnings('ignore')
Load the dataset and find the most common gender and birth country
nobel = pd.read_csv('/kaggle/input/nobel-dataset/nobel.csv')
print(f"Most common gender and birth country are {nobel['sex'].value_counts().index[0]} and {nobel['birth_country'].value_counts().index[0]}.")

top_gender = 'Male'
top_country = 'United States of America'
Output: Most common gender and birth country are Male and United States of America.
Identify the decade with the highest proportion of US-born winners
nobel['usa_born_winners'] = nobel['birth_country'] == 'United States of America'
nobel['decade'] = np.floor(nobel['year'] / 10) * 10
nobel['decade'] = nobel['decade'].astype(int)
df_new = nobel.groupby('decade', as_index=False)['usa_born_winners'].mean()
max_decade_usa = df_new[df_new['usa_born_winners'] == df_new['usa_born_winners'].max()]['decade'].values[0]
print(max_decade_usa)
Output: 2000
sns.relplot(x='decade', y='usa_born_winners', data=df_new, kind='line');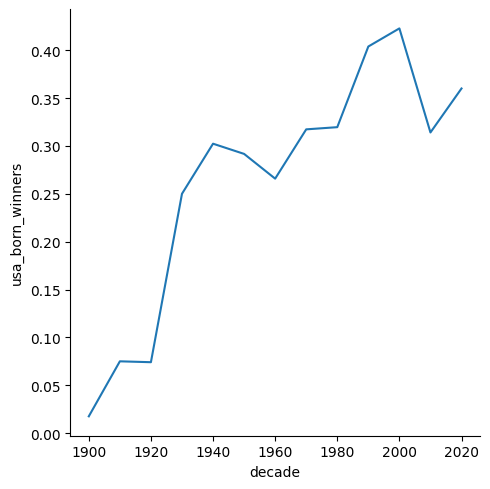
Find the decade and category with the highest proportion of female laureates
nobel['female_winner'] = nobel['sex'] == 'Female'
df_female = nobel.groupby(['decade', 'category'], as_index=False)['female_winner'].mean()
max_female_dict = {
    df_female[df_female['female_winner'] == df_female['female_winner'].max()]['decade'].values[0]: df_female[df_female['female_winner'] == df_female['female_winner'].max()]['category'].values[0]
}
max_female_dict
Output: {2020: ‘Literature’}
sns.relplot(x='decade', y='female_winner', data=df_female, hue='category', kind='line');
Find first woman to win a Nobel Prize
new_df = nobel[nobel['female_winner']]
min_row = new_df[new_df['year'] == new_df['year'].min()]
first_woman_name, first_woman_category = min_row['full_name'].values[0], min_row['category'].values[0]
print(first_woman_name)
print(first_woman_category)
Output: Marie Curie, née Sklodowska
Physics
Determine repeat winners
repeat_winners = pd.DataFrame(nobel['full_name'].value_counts())
repeat_list = list(repeat_winners[repeat_winners['count'] >= 2].index)
repeat_list
Output:
[‘Comité international de la Croix Rouge (International Committee of the Red Cross)’,
‘Linus Carl Pauling’,
‘John Bardeen’,
‘Frederick Sanger’,
‘Marie Curie, née Sklodowska’,
‘Office of the United Nations High Commissioner for Refugees (UNHCR)’]